
 BLOG
BLOG
Key Indicators of US Economic Health: Analysing GDP, Unemployment Rate, and CPI.

Key Indicators of US Economic Health: Analysing GDP, Unemployment Rate, and CPI
The economic health of the United States is intricately measured through various key indicators that provide insights into its overall stability, growth, and inflationary pressures. Among these indicators, three stand out as fundamental pillars: Gross Domestic Product (GDP), Unemployment Rate, and Consumer Price Index (CPI). Each of these metrics serves a crucial role in assessing the current state and future prospects of the US economy.
1. Gross Domestic Product (GDP)

Gross domestic product (GDP) is the total value of all goods and services produced over a specific time period within a country’s borders. It is the broadest quantitative measure of a nation’s total economic activity and a critical indicator of economic health.
Factors Impacting GDP:
- Consumer Spending: The largest component of GDP, consumer spending reflects household expenditures on goods and services.
- Business Investment: Investments in machinery, equipment, and structures by businesses contribute significantly to GDP.
- Government Spending: Public sector expenditure on goods and services, including infrastructure and defense, influences GDP.
- Net Exports: The difference between exports and imports affects GDP, showcasing a country's trade balance.
How It’s Measured:
GDP can be measured in three ways: production (output), income, and expenditure. The expenditure approach, which is the most common, sums up consumption, investment, government spending, and net exports (exports minus imports).

- C: Consumption by households
- Investment by businesses
- G: Government spending
- X: Exports
- M: Imports
You can calculate GDP using a variety of methods, such as the production approach and the income approach:
Production Approach: This method calculates GDP by adding the value of all final goods and services produced within a country during a specific period. It is also known as the output or value-added approach. The formula is:

Income Approach: This method calculates GDP by summing all the incomes earned in the production of goods and services within a country during a specific period. This includes wages, rents, interest, and profits. The formula is:

GDP growth indicates a growing economy, which typically leads to higher employment levels and increased income. Conversely, declining GDP can signal economic problems, leading to lower employment and income levels. Policymakers use GDP data to make decisions about interest rates, tax policies, and government spending to either stimulate or cool down the economy.
Limitations: While GDP is a powerful tool, it has its limitations. GDP per capita provides an average but does not account for the distribution of income among a country's residents. This means it might mask disparities and inequalities within the population.
Gross Domestic Product (GDP) per capita is a critical economic indicator that measures the average economic output per person in a country. We calculate it using the following formula:

Furthermore, GDP does not take into account whether the nation's rate of growth is sustainable in the long term. Rapid economic growth could come at the expense of environmental degradation or depletion of natural resources. Additionally, GDP does not measure the informal economy or non-market transactions.
Significant informal sectors exist in many countries, particularly developing ones, where economic activities remain unrecorded, resulting in an underestimation of true economic activity.
2. The Unemployment Rate
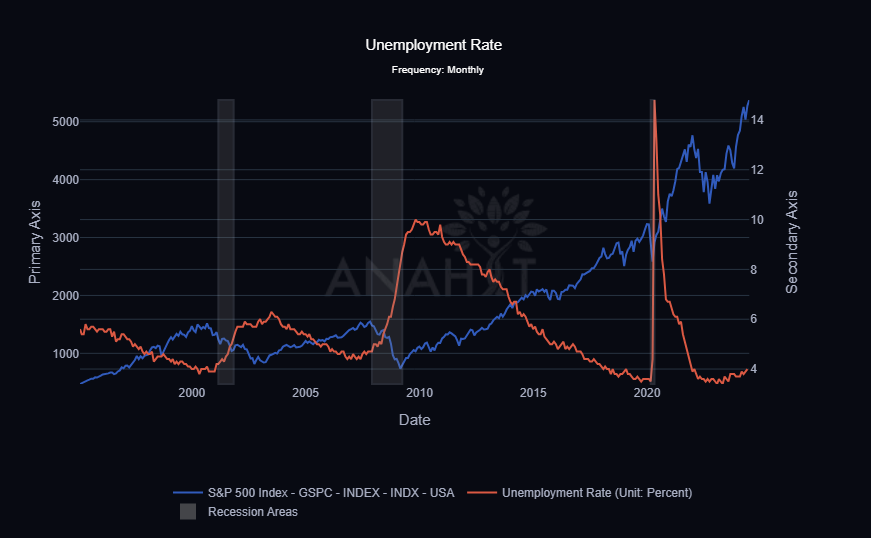
The unemployment rate measures the percentage of the total labour force that is unemployed but actively seeking employment and willing to work. It is a vital indicator of economic health, reflecting the ability of an economy to provide jobs for its citizens.
Types of Unemployment:
- Frictional Unemployment: Temporary unemployment while workers search for new jobs.
- Structural Unemployment: Skills mismatches between available jobs and workers' qualifications.
- Cyclical Unemployment: Resulting from economic downturns or recessions.
- Seasonal Unemployment: Occurs due to seasonal fluctuations in industries such as agriculture or tourism
How It’s Measured: The unemployment rate is calculated by dividing the number of unemployed individuals by the total labour force, then multiplying by 100.

High unemployment rates can indicate economic distress, leading to lower consumer spending and increased government spending on social services. Conversely, low unemployment rates can signal a robust economy. However, extremely low unemployment might lead to inflationary pressures as employers compete for a limited pool of workers, driving up wages and, consequently, prices.
Limitations: The unemployment rate does not account for underemployment or those who have stopped looking for work (discouraged workers). Therefore, it may understate the true level of economic hardship.
3. Consumer Price Index (CPI)

The Consumer Price Index (CPI) is used to measure changes in the price level of a basket of consumer goods and services purchased by households. It is the most widely used indicator of inflation, reflecting the cost of living.
Components of CPI:
- Core CPI: Excludes volatile food and energy prices to focus on underlying inflation trends.
- Food and Energy CPI: Includes prices of food and energy products, reflecting immediate cost-of-living impacts on consumers.

How It’s Measured: The Bureau of Labor Statistics (BLS) calculates the CPI by averaging price changes for each item in the predetermined basket of goods. The Bureau of Labour Statistics (BLS) periodically collects prices and computes the index monthly.
Why It Matters: Inflation, as measured by the CPI, impacts purchasing power, cost of living adjustments, and monetary policy. Moderate inflation is typical of a growing economy, but high inflation can erode purchasing power and savings. Deflation, on the other hand, can indicate an economy is in trouble, leading to reduced consumer spending and increased unemployment.
Limitations: CPI does not capture the experiences of all demographic groups equally, as spending habits can vary significantly across different income levels, ages, and regions. Furthermore, it only measures prices, not the quality of goods and services.
Personal Consumption Expenditures (PCE) and Personal Consumption Expenditures Price Index (PCEPI) are both essential measures of inflation used to gauge changes in the cost of goods and services over time.
Personal Consumption Expenditures (PCE)
The Personal Consumption Expenditures (PCE) is a measure of the total amount of goods and services consumed by households. It is a comprehensive measure that includes expenditures on durable goods, non-durable goods, and services. The PCE, one of the primary components of the Gross Domestic Product (GDP), analyses consumer spending patterns as well as a country's overall economic health.
The Personal Consumption Expenditures Price Index (PCEPI)
The Personal Consumption Expenditures Price Index (PCEPI) measures the average price change for all domestic personal consumption. It reflects changes in the prices of goods and services purchased by consumers and is considered a reliable indicator of inflation. When setting monetary policy, the Federal Reserve prefers the PCEPI because it takes into account changes in consumer behaviour and offers a more comprehensive measure of inflation than the Consumer Price Index (CPI).
Importance of PCEPI
The PCEPI is crucial for policymakers, particularly the Federal Reserve, as it provides a broad and flexible measure of inflation. By considering changes in consumer behavior and a wide range of expenditures, the PCEPI helps to understand the true cost pressures faced by households, allowing for more informed decisions regarding interest rates and other monetary policies.
Both PCE and PCEPI are vital for understanding consumer spending and inflation. The PCEPI, with its comprehensive scope and adaptive nature, offers a more nuanced view of inflation trends, making it a preferred measure for economic policy decisions. Understanding these indices helps to grasp the broader economic picture and the factors influencing consumer prices and economic stability.
Interplay and Policy Implications
Monetary Policy Responses: Central banks, like the Federal Reserve in the US, utilize these indicators to formulate monetary policies. For example, in periods of economic slowdown (low GDP growth and high unemployment), central banks may lower interest rates to stimulate borrowing and spending, thus boosting economic activity. Conversely, during periods of high inflation (elevated CPI), central banks may raise interest rates to curb spending and stabilise prices.
Fiscal Policy Considerations: Governments also adjust fiscal policies, including taxation and public spending, based on these indicators. For instance, during economic downturns (high unemployment), governments may increase infrastructure investments to create jobs and stimulate growth.
Understanding these metrics allows us to better navigate the complexities of economic trends and make decisions that contribute to a healthier, more resilient economy. As we move forward, staying informed about these key indicators will remain essential to adapting to economic changes and challenges. Leverage anahit.ai, the best free real-time investment insight platform, to stay informed and make better investment decisions.
Opeyemi Olu-David
Related posts
We’ve got a lot of awards for our products and services that became popular in the world.


